Why BI Dashboards Are Integral to Our Consulting Projects
Highlights
At Prime 8, we believe business intelligence (BI) dashboards are essential for data-driven strategies and recommend them as part of nearly every consulting project.
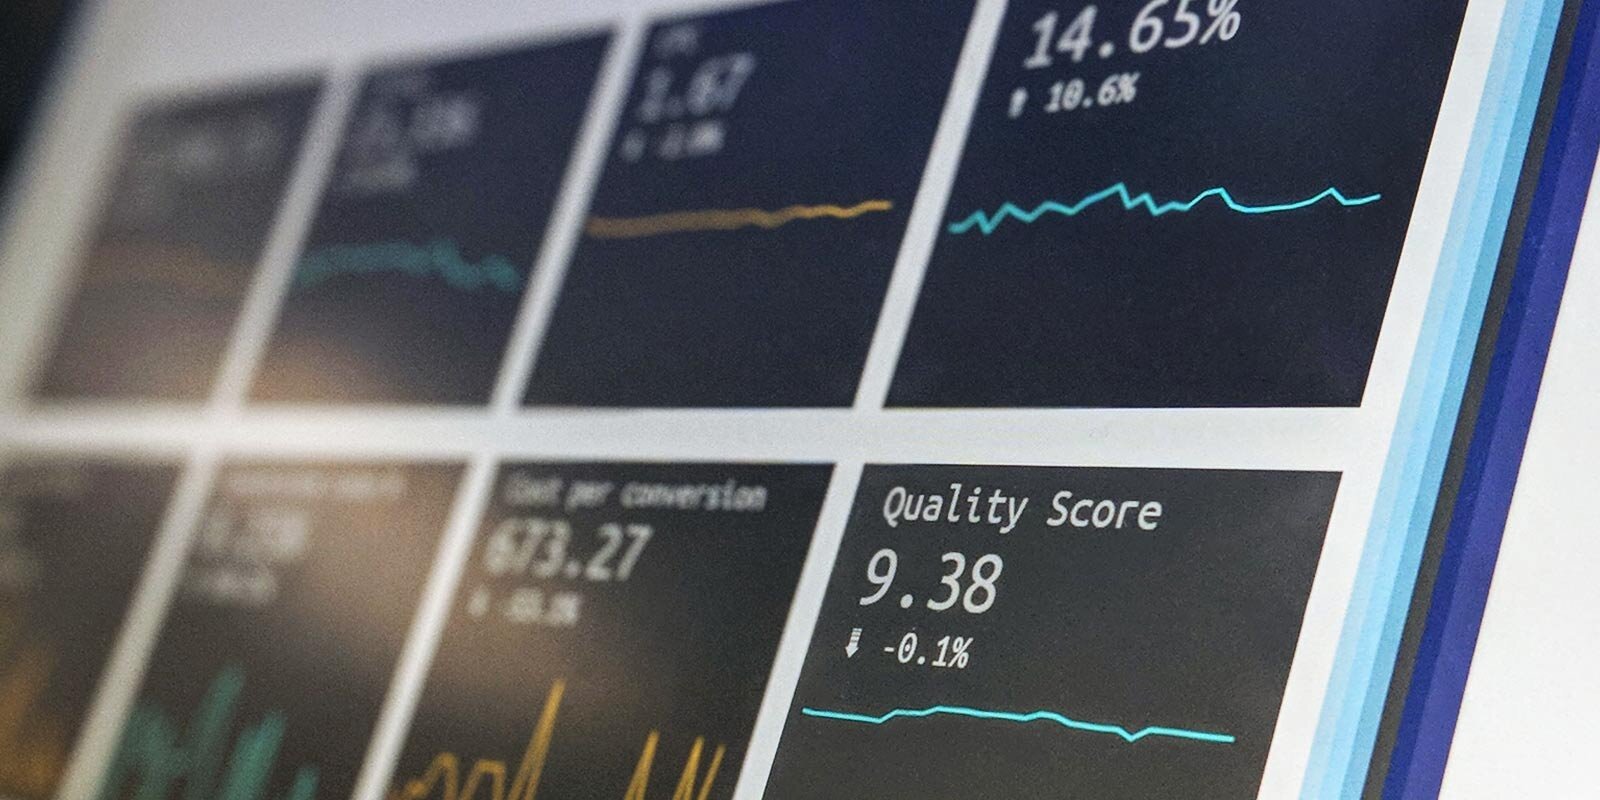
The right dashboard can deliver insights that can benefit a business in numerous ways, including data visualization, real-time data analysis, performance measurement, project status, risk assessment and mitigation, and customer experience enhancement.
As part of our project lifecycle management, we start looking at dashboard options during the discovery phase and frequently develop prototypes to assess different options.
As more organizations adopt data-driven business strategies, they’re also increasing their use of business intelligence (BI) dashboards to stay on top of key performance indicators (KPIs) and drive better decision-making and results.
At Prime 8, we’re incorporating dashboards into our consulting projects at an increased pace. In our experience, greater use of dashboards has a multiplier effect on the value that can arise from any single client engagement and encourages greater adoption of data-driven approaches overall, delivering more business insights and actionable intelligence.
Research by Forrester and others backs this up: Compared to organizations that are just getting started, companies that have already made a significant commitment to using tools such as BI dashboards are eight times more likely to say they grew by 20% or more.
Our Approach to Dashboards in Consulting Projects
The idea behind a BI dashboard is to create a single, convenient way to get access to the data all stakeholders need to do their jobs. This can include:
Reporting: Accessing up-to-date results on initiatives such as sales programs and new product/service introductions
Analysis: Charting overall trends or making comparisons between different data sets (e.g., regional performance differences)
Exceptions: Pinpointing anomalies or exceptions that may be harbingers of larger issues
Processes: Getting an instant read on the current state of a specific business process, such as onboarding of new hires
Collaboration: Facilitating the distribution of key insights and data across teams, promoting transparency and collaborative decision-making
At Prime 8, BI dashboards now play an essential role in our overall project lifecycle management. During a project’s discovery phase as we interview stakeholders and examine data sets, we are also scoping out the role that a BI dashboard can play in supporting the client’s needs.
Once the discovery phase is complete, we often develop prototypes to showcase different dashboard options. Thanks to today’s low-code and no-code programming options, dashboard projects that once might have taken months can now be accomplished in weeks or even days.
The Benefits We've Seen from Using BI Dashboards
Here’s a look at six benefits we’ve found to using BI dashboards.
DATA VISUALIZATION
Computers are great at processing text and numbers in rows and columns, but the human brain is far better at handling information presented visually. By conveying information through data visualization aids such as charts and graphs, BI dashboards make it easier and faster for managers to make data-driven decisions — to spot trends, correlate data, and identify problems and opportunities.
For example, one of our clients, a large technology provider, wanted to increase revenue by expanding its partner program and also help more partners achieve top-tier performance, but consolidating the data and resources needed to make it happen was proving difficult. Our consultant collaborated with individual teams to identify the performance data that needed to be tracked. In a matter of weeks, we built a prototype dashboard that presented the information in clear, visual format.
The dashboard, in conjunction with a related partner training program, helped increase revenue by 67% year over year and resulted in over four hundred new partners achieving top-tier status.
REAL-TIME DATA ANALYSIS INSIGHTS
The pandemic taught everyone that business conditions can change quickly. But even before then, fast-moving business environments were becoming a fact of life. Today, the need for real-time data analysis is clear: Waiting weeks or months to do a post-mortem on a sales program or a client engagement is no longer working. Our clients demand access to data and insights in real time.
With one client, we addressed this challenge by setting up real-time win-loss analysis dashboards. Sales managers can now get an instant read on sales best practices — which techniques and processes are effective and which need to be strengthened with training, better data, or targeted technology. Data based on this analysis can also be used to build visualizations that can be shared across the organization.
PERFORMANCE MEASUREMENT
One of the most popular ways to use BI dashboards is to track specific KPIs. Unfortunately, while the KPIs may be obvious, collecting and presenting them in a way that’s effective is not always so straightforward. For example, we worked with a global tech company that was investing heavily in global marketing efforts (including extensive use of incentives and rebates) and was experiencing overall success, but managers had no real insight into which specific investments were making an impact or how the situation might differ from one region to another.
To address the issue, our consultants met with multiple teams to get consensus on how data would be measured and interpreted. They then put in place a global data-gathering system, making it possible to collect, analyze, and compare information in ways that had been previously impossible. They developed nine Power BI dashboards that analyzed worldwide marketing investment, making it possible to quickly visualize — down to the category level — how money was being spent anywhere in the world.
PROJECT MANAGEMENT EFFICIENCY
Successful project management has always required a range of skills including planning, budgeting, and scheduling. Today, add data analysis to that skill set. At Prime 8, we see data visualization through BI dashboards as a key project management trend, along with other developments such as AI and Agile methodologies.
By making it possible to create visually appealing and easy-to-understand charts and graphs, dashboards enable project- and program managers to:
Track the progression of one or more projects
Optimize resources
Improve project efficiency
Model different completion scenarios
Minimize risks
With a BI dashboard, the information can also be more quickly and easily shared with clients and other project stakeholders.
RISK ASSESSMENT AND MITIGATION
While BI dashboards are effective at helping you get where you want to go — better performance and success — don’t overlook the vital role they can play in steering you away from places you don’t want to go: high risk situations that increase your vulnerability to performance degradation and business losses.
A dashboard designed for the needs of auditors and risk analysts can deliver the advanced analytics, real-time reporting, and regulatory or compliance notifications you need to stay one step ahead of potential hazards and enhance operational resilience. Along with better decision-making and faster time to market, we see risk identification and management as a compelling business case for BI dashboards.
Customer Experience Enhancement
Your customers now have more opportunities to engage and interact with you — on the phone, your website, social media, and in person. This raises the stakes for how you manage and take advantage of these interactions. Research has demonstrated that regardless of the touchpoint they’re using, customers expect a consistent level of personalized, contextualized service.
Dashboards specifically focused on monitoring and managing customer experiences are increasingly essential in today’s multi-channel marketing environment. Pulling data from across the entire customer journey, any employee in your organization can be equipped to deliver an outstanding customer experience.
At Prime 8, we feel so strongly about the use of dashboards for delivering customer experience, we’ve identified it as one of our six BI best practices decision-makers must adopt.
Let Us Help You Get More Out of Your BI Dashboards
At Prime 8 Consulting, we strive to help our clients get the most out of data, delivering business insights and actionable intelligence. Whether you are already working with BI dashboards, looking to go to the next level with your data-driven strategies, or are just getting started and want a quick and easy way to test the waters, let us help you get there.


